buildings icon

Business Intelligence

buildings icon

Business Intelligence

buildings icon

Business Intelligence

Smarter Insights. Stronger
and Faster Decisions.

OneAvant BI transforms complex data into clear, actionable intelligence by connecting your all your systems from ERP to Sales into one real-time databoard.

Dashboard interface of OneAvant BI showing analytics charts for orders, net revenue, and performance by location, with data visualization rings and sharing options.

OneAvantBI

OneAvantBI

OneAvantBI

Why OneAvant BI

OneAvant BI links all your data to give you one smart view of your business.

Connected Intelligence

Unify every system into one smart network that keeps data flowing seamlessly.

Diagram connecting ERP, CRM, and HR systems to a central hub, illustrating how OneAvant unifies business data into a single smart network for seamless workflow.

Live Performance Dashboards

Track key metrics in real time with dashboards built for your workflow.

Dashboard interface showing progress bars, charts, and pie graphs, symbolizing OneAvant’s real-time tracking of key business metrics.

Visual Automated Reports

Turn complex data into clear, visual reports that drive quick action.

Document icon with charts, progress bars, and automation symbols, representing OneAvant’s ability to convert complex data into clear, automated visual reports.

Features

Features

Features

Key Features

Key Features

ERP dashboard showing a connected Sage API dataset with sync status and connection badge on a green and purple gradient background.

Datasets and Integrations

Connect all your data sources in one place and streamlined.

Connect APIs like Square POS, Cheerfy, Sega, and more

Connect APIs like Square POS, Cheerfy, Sega, and more

Connect APIs like Square POS, Cheerfy, Sega, and more

View dataset tables, sync logs, and activity updates

View dataset tables, sync logs, and activity updates

View dataset tables, sync logs, and activity updates

Manual or scheduled syncing for real-time accuracy

Manual or scheduled syncing for real-time accuracy

Manual or scheduled syncing for real-time accuracy

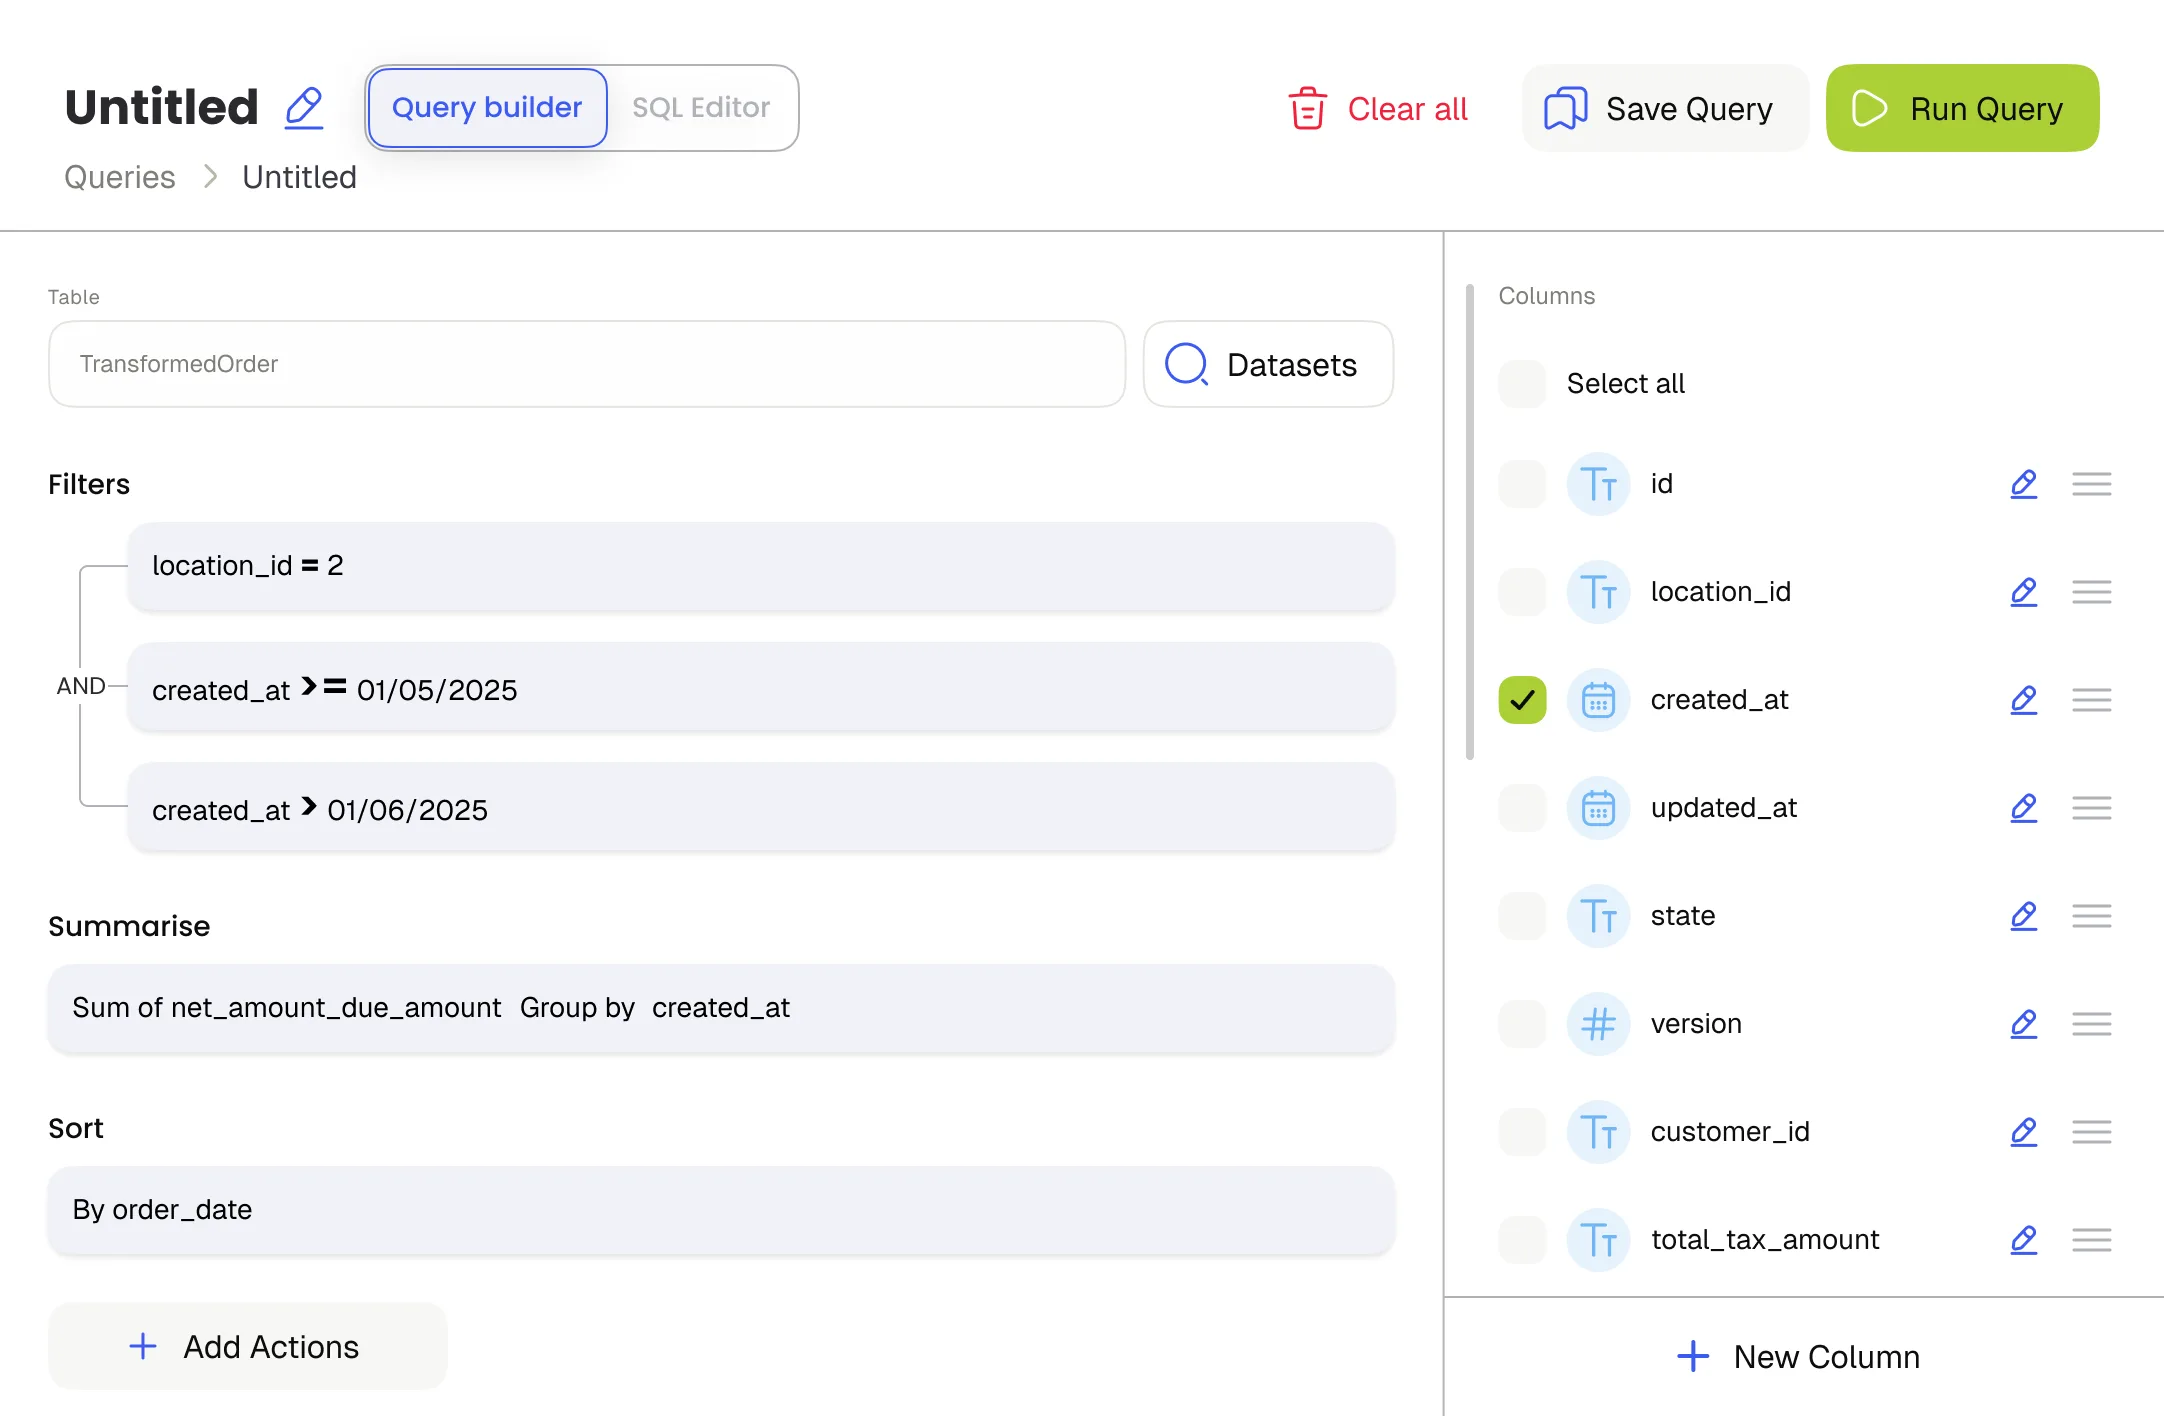
Queries and Analysis

Build, explore, and visualize data instantly.

Create and edit custom queries with builder and SQL editor

Create and edit custom queries with builder and SQL editor

Create and edit custom queries with builder and SQL editor

Apply filters, sorting and parameters for deeper insights

Apply filters, sorting and parameters for deeper insights

Apply filters, sorting and parameters for deeper insights

Visualize data as bar, line, or pie charts and number cards

Visualize data as bar, line, or pie charts and number cards

Visualize data as bar, line, or pie charts and number cards

Query builder interface displaying filters and summarized data fields for SQL-based analytics within the ERP system.
Databoard dashboard preview displaying KPI charts and sharing options with duplicate, edit, and delete tools in an ERP reporting interface.

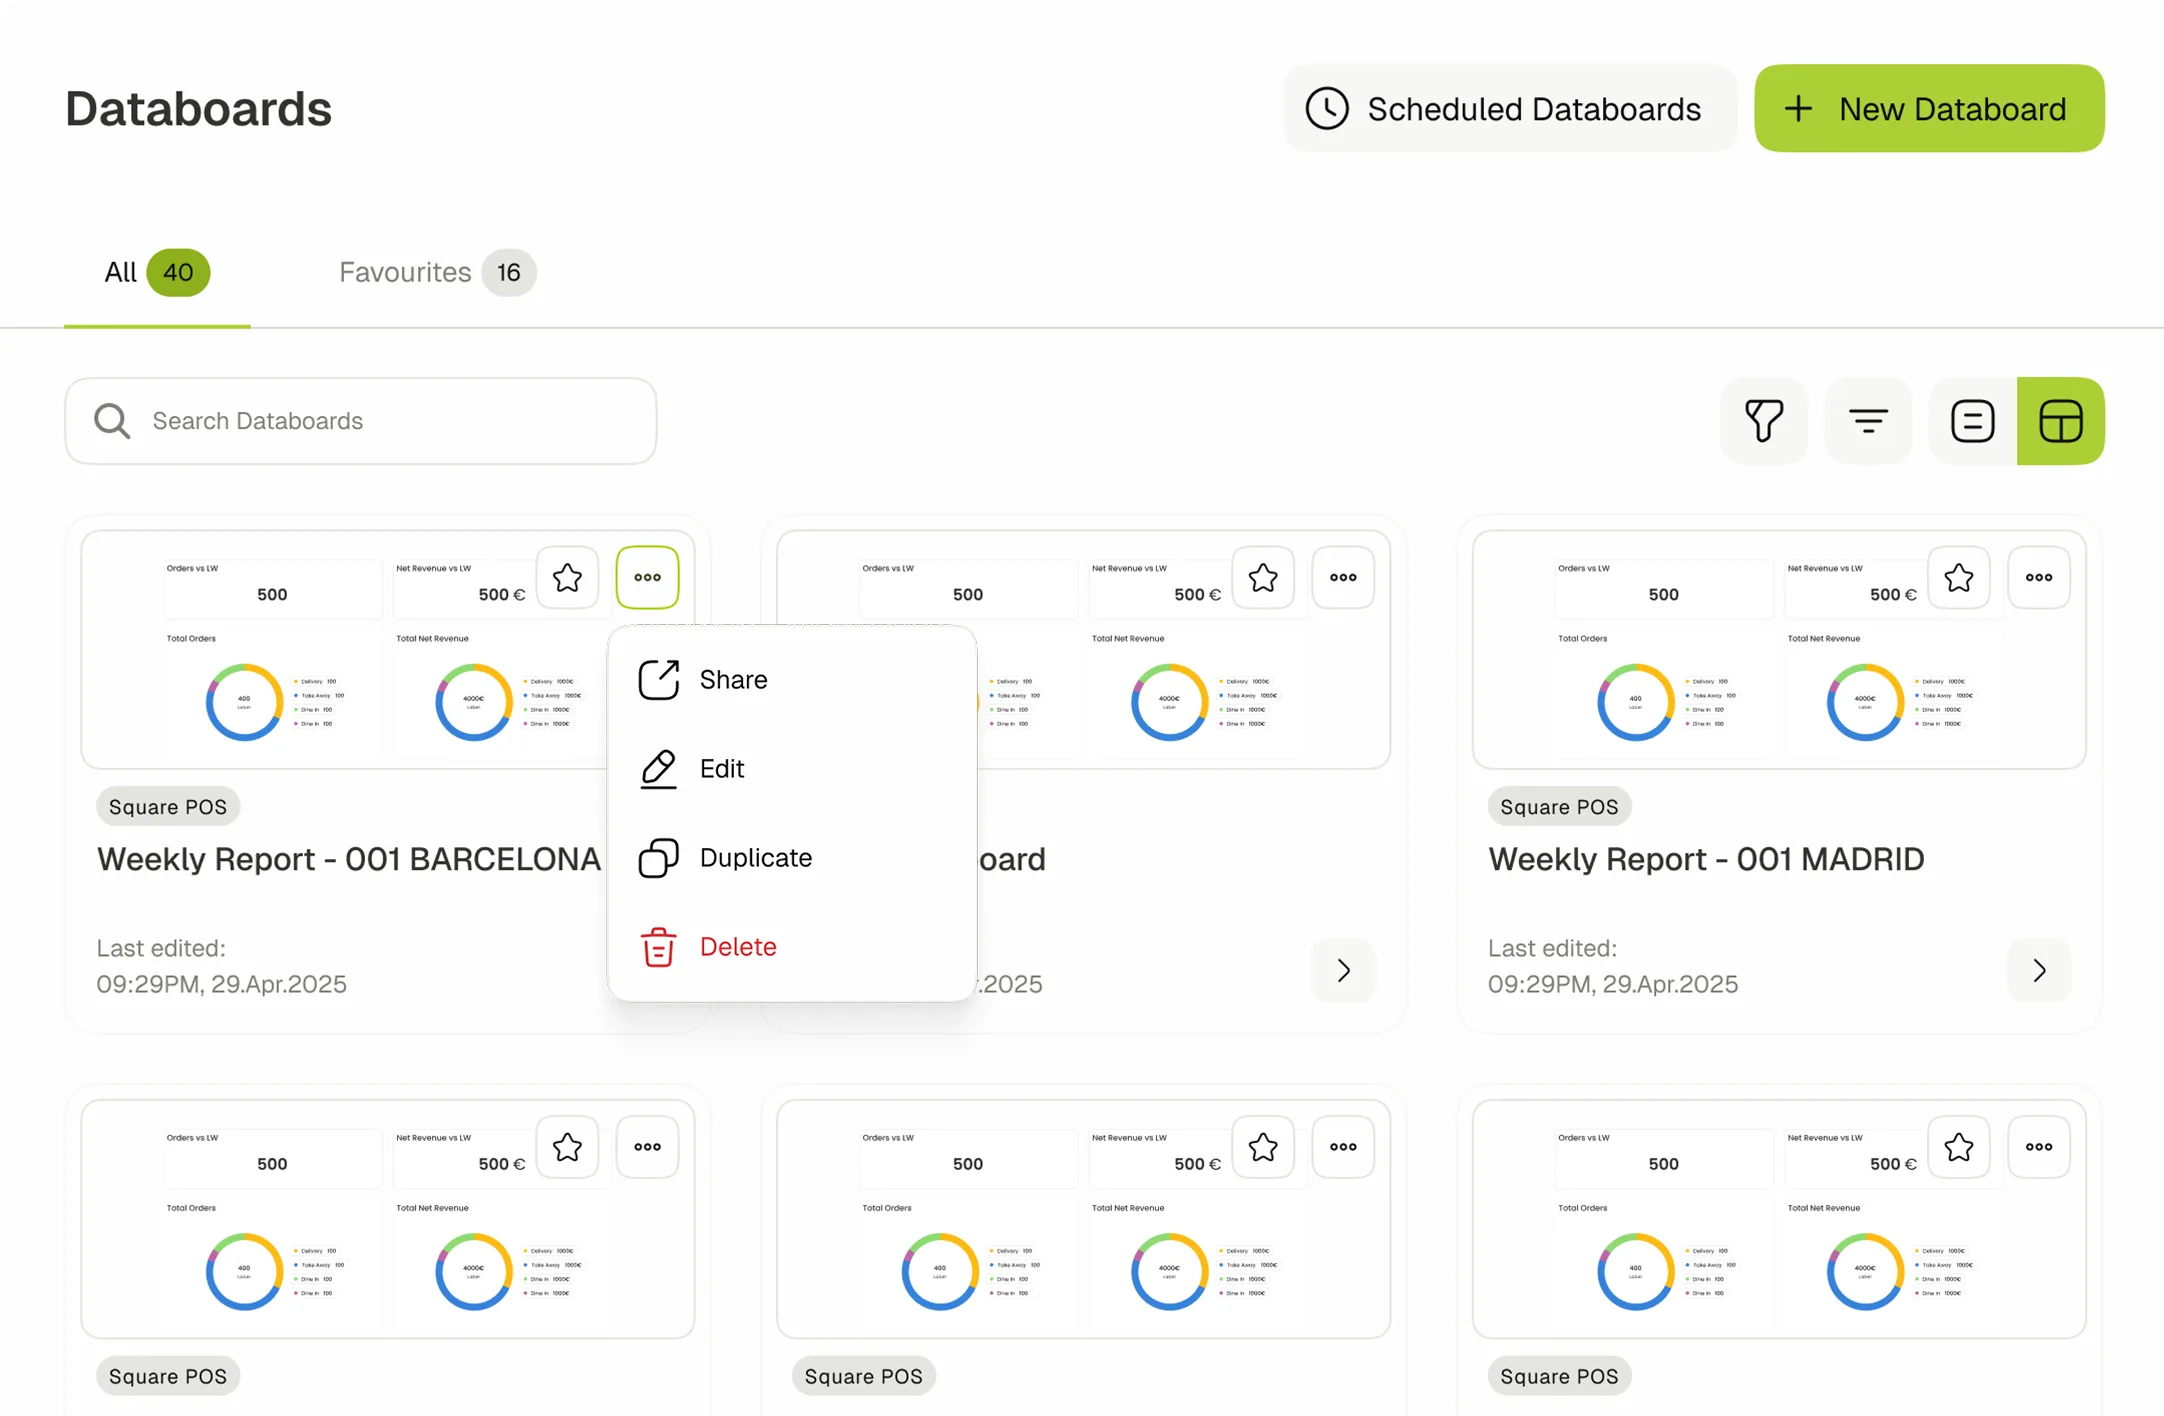
Databoards and Reporting

Monitor every goal and performance metric in one dashboard.

Combine KPIs, visuals, and text into customizable dashboards

Combine KPIs, visuals, and text into customizable dashboards

Combine KPIs, visuals, and text into customizable dashboards

Schedule automatic daily, weekly or monthly reports

Schedule automatic daily, weekly or monthly reports

Schedule automatic daily, weekly or monthly reports

Share insights via PDF, link, Slack, or email

Share insights via PDF, link, Slack, or email

Share insights via PDF, link, Slack, or email

Integrations

Seamlessly connects with your favorite tools.

Placeholder logo
Placeholder logo
Placeholder logo
Placeholder logo
Placeholder logo
Placeholder logo
Placeholder logo
Placeholder logo
Placeholder logo
Placeholder logo
Placeholder logo
Placeholder logo
Placeholder logo
Placeholder logo
Placeholder logo
Placeholder logo

Connect to Content

Add layers or components to infinitely loop on your page.

Core Features

Core Features

Core Features

Everything to Drive Decisions

icon

Unified Data Hub

Connect ERP, GMS, sales, and external APIs into one smart, synchronized system.

icon

Unified Data Hub

Connect ERP, GMS, sales, and external APIs into one smart, synchronized system.

icon

Unified Data Hub

Connect ERP, GMS, sales, and external APIs into one smart, synchronized system.

icon

Custom Queries in Real Time

Create and visualize data queries instantly, no waiting, just live results.

icon

Custom Queries in Real Time

Create and visualize data queries instantly, no waiting, just live results.

icon

Custom Queries in Real Time

Create and visualize data queries instantly, no waiting, just live results.

icon

Central Databoards

Monitor all KPIs from every department in one clear, unified view.

icon

Central Databoards

Monitor all KPIs from every department in one clear, unified view.

icon

Central Databoards

Monitor all KPIs from every department in one clear, unified view.

icon

Continuous Source Sync

Keep every metric updated automatically across all connected systems.

icon

Continuous Source Sync

Keep every metric updated automatically across all connected systems.

icon

Continuous Source Sync

Keep every metric updated automatically across all connected systems.

icon

Automated Reporting

Schedule recurring reports that send themselves — always on time.

icon

Automated Reporting

Schedule recurring reports that send themselves — always on time.

icon

Automated Reporting

Schedule recurring reports that send themselves — always on time.

icon

Instant Export & Share

Download and share analytics in seconds with one-click exporting.

icon

Instant Export & Share

Download and share analytics in seconds with one-click exporting.

icon

Instant Export & Share

Download and share analytics in seconds with one-click exporting.

icon

Multi-View Visuals

View your data as bars, lines, pies, or numeric cards — whatever fits best.

icon

Multi-View Visuals

View your data as bars, lines, pies, or numeric cards — whatever fits best.

icon

Multi-View Visuals

View your data as bars, lines, pies, or numeric cards — whatever fits best.

icon

Cloud-Secure & Scalable

Protected by enterprise-grade security and built to grow with your business.

icon

Cloud-Secure & Scalable

Protected by enterprise-grade security and built to grow with your business.

icon

Cloud-Secure & Scalable

Protected by enterprise-grade security and built to grow with your business.

Run Business Smarter

Connect ERP, CRM, and analytics in one unified view.

Run Business Smarter

Connect ERP, CRM, and analytics in one unified view.

Run Sales & Operations Smarter

All your sales and CRM in one platform

Built For Your Insights

icon

Business Owners

icon

Business Owners

icon

Business Owners

icon

Retail & Hospitality Leaders

icon

Retail & Hospitality Leaders

icon

Retail & Hospitality Leaders

icon

Sales & Marketing Teams

icon

Sales & Marketing Teams

icon

Sales & Marketing Teams

icon

Finance & Operations

icon

Finance & Operations

icon

Finance & Operations

From Data to Decisions, Instantly.

OneAvant BI connects insights from ERP, Sales, and beyond into a single intelligent databoard built for growth.